
B & W
Linearisation
Create ICC profiles easily
As a professional working with large format printers—mostly on FineArt papers—black and white printing has become an increasingly important part of my work.
Having used X-Rite’s i1 instruments from the very beginning, I can confirm that they perform well and continue to improve with each new generation.
That said, there have always been certain papers where the default calibration fails to deliver optimal results, especially for black and white prints.
Today’s LFP printers are highly advanced and typically don’t require much additional optimization or profiling.
However, I’ve noticed that with an increasing number of FineArt papers, it becomes necessary to correct gray tones more precisely.
The solution is linearisation, which generally provides excellent results.
In response to specific requests, I developed a purely mathematical version of the process to serve as a neutral baseline—making it possible to apply any custom tonal curve afterward.
This special version is now available here as a web-based tool.
For conventional B&W linearisation workflows, a variety of established calibration tools remain widely available and effective.
The process is simple: print a grayscale chart, measure it with a spectrophotometer and export it as a CGATS *Lab text file. You need to upload that measurement file here and the application will create
an ICC profile from it.
This application and the downloadable charts use Gray Gamma 2.2 profile or its RGB equivalents: AdobeRGB1998 or ClayRGB. However, you can use any input profiles you prefer.
Also, It is much more convenient to use charts in RGB colour space rather than CMYK.
1st method: You can print these charts as a normal image, so print them with the corresponding (calibrated) printing ICC profile.
2nd method: You can print them with the printer’s special B&W mode (latest Epson and Canon printers have this printing mode).
Normally none of the manufacturers create Gray ICC profiles, so you have to print the test charts without any profile.
Most of the spectrophotometers performs much better in “Spot reading mode”, so I prefer to use this method. The downloadable charts also have “Spot readable” versions.
If you are using single line scan methods (this is the weakest point of the whole process), I’d prefer to repeat it 2 or 3 more times and use the average of the results.
I have also attached a 3x18 patch chart, so you can scan it once.
The application understands multiple readings and will use the avarage value.
I have also attached some RGB .RWXF (Measure Reference Chart Workflow files for i1Profiler), it has the predefined RGB values. 52-step and 18-step charts are perfect for most applications.
You can save the measurements as an i1Profile CGATS Lab text file or as a ProfileMaker CGATS Lab text file.
You can upload the CGATS file with the measured *Lab values and the application will display them in a visually more readable graph form and calculate the values for the Linearisation.
As a result, you can download various ICC profiles ready to use in Photoshop or any other application.
As a bonus, these profiles include floating point data in addition to the default 16-bit values!
DEVICE LINK PROFILES
From the beginning, it was so disturbing that I had to copy ICC profiles deep inside the system folders every time.
There are also complaints about existing methods which involve several steps of assigning and converting between profiles. That is not the intended way to use them.
There is a more elegant way which also allows to you store your profiles in a much more organised way in any folder on your computer: the Device Link profiles.
Device Link profile is a special ICC profiles that can only be applied if the source and destination colour spaces are the same.
The whole transformation process is stored in a small profile.
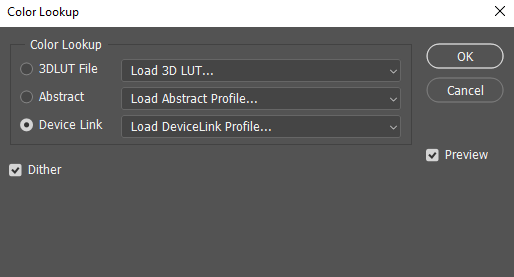
And the good news for Photoshop users is that you can apply Device Link profiles from another dialog box, too:
Image → Adjustments → Colour Lookup...
and select Open Device Link profile in the dialog box.
The bad news is that Photoshop cannot handle Gray profiles as Device Link profiles (some applications can use them), so you need to convert your working colour space from
GRAY to an RGB space (such as AdobeRGB), and then you can apply RGB Device Link profiles. And that’s it!
These profiles are compliant with the latest ICC V4.4 specifications and should work in all colour-managed applications.
Unfortunately, Device Link profiles are not a common profile type and not all CMS can handle them without problems.
ICC Description Tag
You can add any text to the Description tag in the ICC profile. This text may or may not be displayed when you search for ICC profiles in your print application.
The default is the uploaded CGATS filename. (Use EN character set only!)
Gray or RGB Colour Space?
Unfortunately Photoshop cannot handle Device Link profiles in Gray colour space, but can handle Device Link profiles in RGB colour space, so download the RGB version if you use Photoshop.
If you are using other (non-Adobe) software that can read Gray Device Link profiles, this is the recommended way to go!
If you like the results you can support my work by "buying me a coffee".
This web-application is free for personal use or for experimenting.
For commercial purpose or if you use this application frequently, please donate money - depending on how often you use it.
YOUR DATA
All data is deleted from the server daily.
Downloadable profiles are deleted immediately after the download.
CREDITS
This web-application uses Marti Maria Saguer's amazing LittleCMS engine.
ABOUT ME
My name is Tamas Littmann. I would like to thank you for using this application. If you find this application useful or if you have any ideas, suggestions - or even criticisms -,
if you find a bug or just want to say hello, feel free to contact me. I appreciate all feedback.
CONTACT ME
info {at} narvallabs {dot} com
info {at} fineartmasters {dot} eu
APP VERSION: V1.4.0
PSD & TIFF chart version: V1.0.1 (iSis2 charts have known bugs!)
i1Profiler RWXF version: V1.0.1